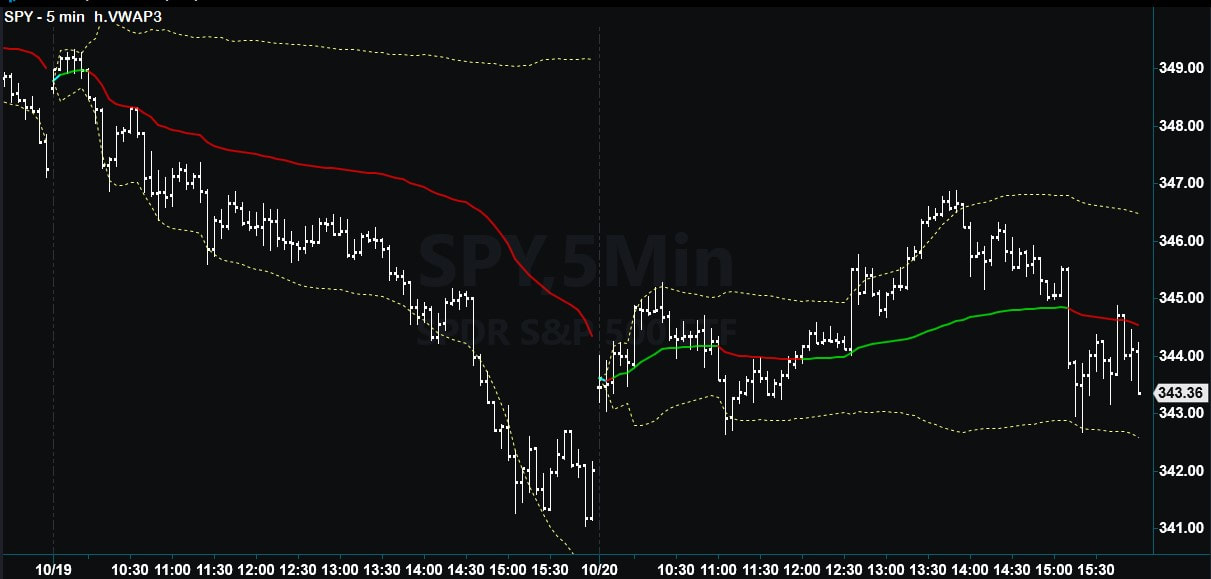
Dynamic Deviation Band
+2 and -2 standard deviations from VWAP is supposed to represent "the" extreme excursion of price from VWAP. If you've been trading this methodology for long, you know that idea is useful, but not one you can always depend upon. The following is a picture of SPY, 5 minutes interval of October 19 and 20, 2020. VWAP with the +2 and -2 standard deviation bands are displayed:
While the standard deviation bands provide a hint where the maximum price excursion may be, both IBH VWAP and IBH VWAP ZSCORE contain intelligence that evaluates price action of previous sessions to develop a unique hypothesis of the maximum deviation for the current session. The hypothesis is displayed in the following picture where the indicator added the blue/gray bands, called DynamicUpper and DynamicLower, to the output:
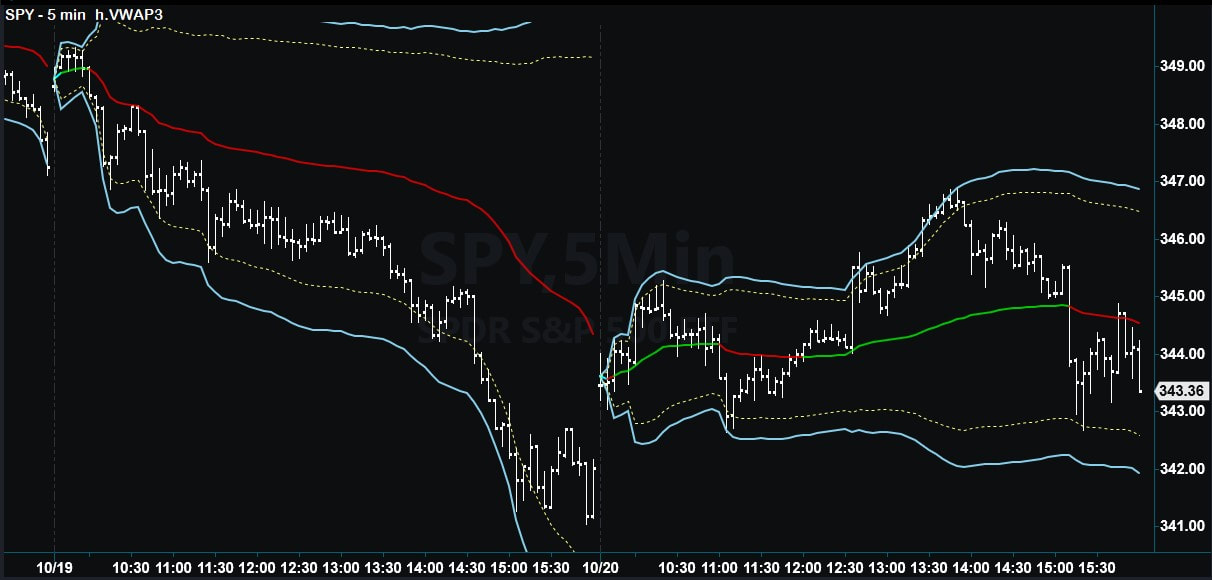
Extending your VWAP trading plan to include the DynamicUpper and DynamicLower deviation bands may improve your trading results.
