Standard Market Profile Workspace for ES Trading
There are many ways to configure the Market Profile Combination Pack to support your trading of ES. This section explains the manner in which I set up a trading workspace, starting with the largest timeframe (monthly) through to the smallest timeframe (regular trading hours).
Large Timeframe
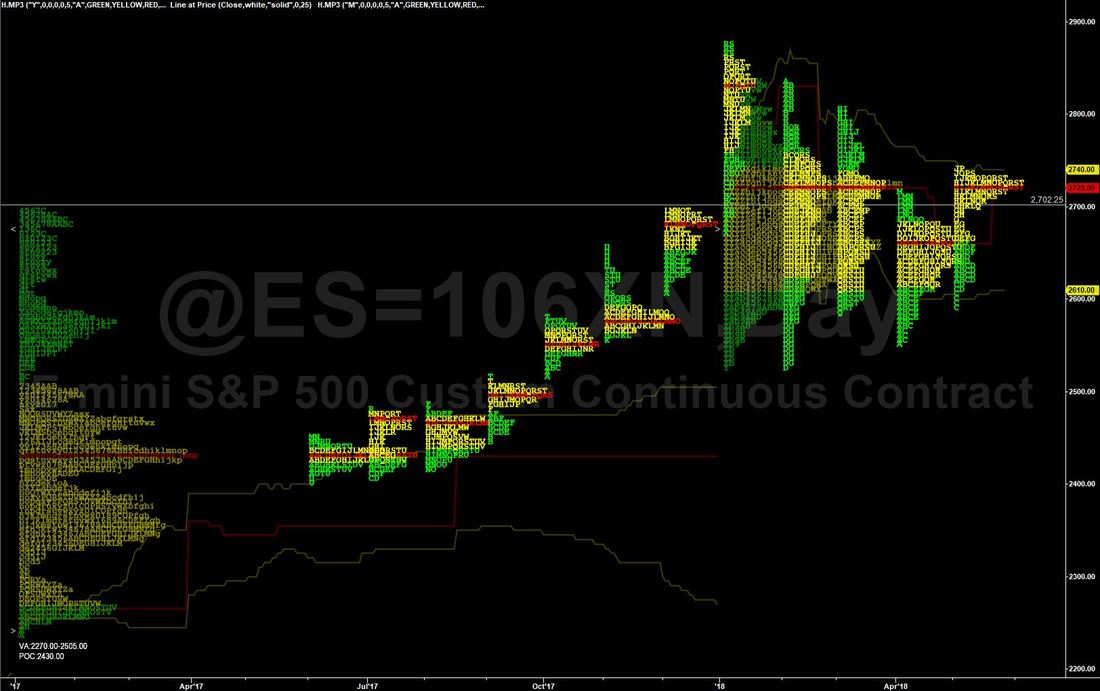
The sole purpose of this chart is to visualize the areas where the market spent "a lot of time" and "a little bit of time" trading over a very long timeframe. To do this, I use the @ES=106XN daily chart with two instances of H.MP3 and one instance of the built-in Line at Price indicator. This is my "go to" generic, large timeframe chart.
- The @ES=106XN candles/bars are hidden by checking the "Make price data invisible" box on the style tab of the format symbol window; I hide the candles to make reading the profile easier
- The H.MP3 indicators were inserted with "Y" and "M" sessions. I set "naked POC: Show it", "Tails POC: Show it", and "Anomaly POC: Show it" to 0, set Merge=5
- H.MP3, Session:Type="Y" is displayed with "TPO: Font_Transparency"=75, "Developing VA: Show it?=True, "Previous VA: Show it?"= False
- H.MP3, Session:Type="M" is displayed with "Developing VA: Show it?=False, "Previous VA: Show it?"= False , "Number of Profile to Keep"=12
Drill-down
It appears that price has been "balancing" during the last five months (since the most recent all-time high (ATHI) was set. I decided to drill down into that trading range. I changed the chart interval to 240 minutes, disabled one of the instances of H.MP3 and set the other instance to "A" as follows:
- Session: Type="A", Session: Start Time=1600 (see vertical line label), Arbitrary Session: Start Date=20180126, Merge=2.5, Developing VA: Show it?=False
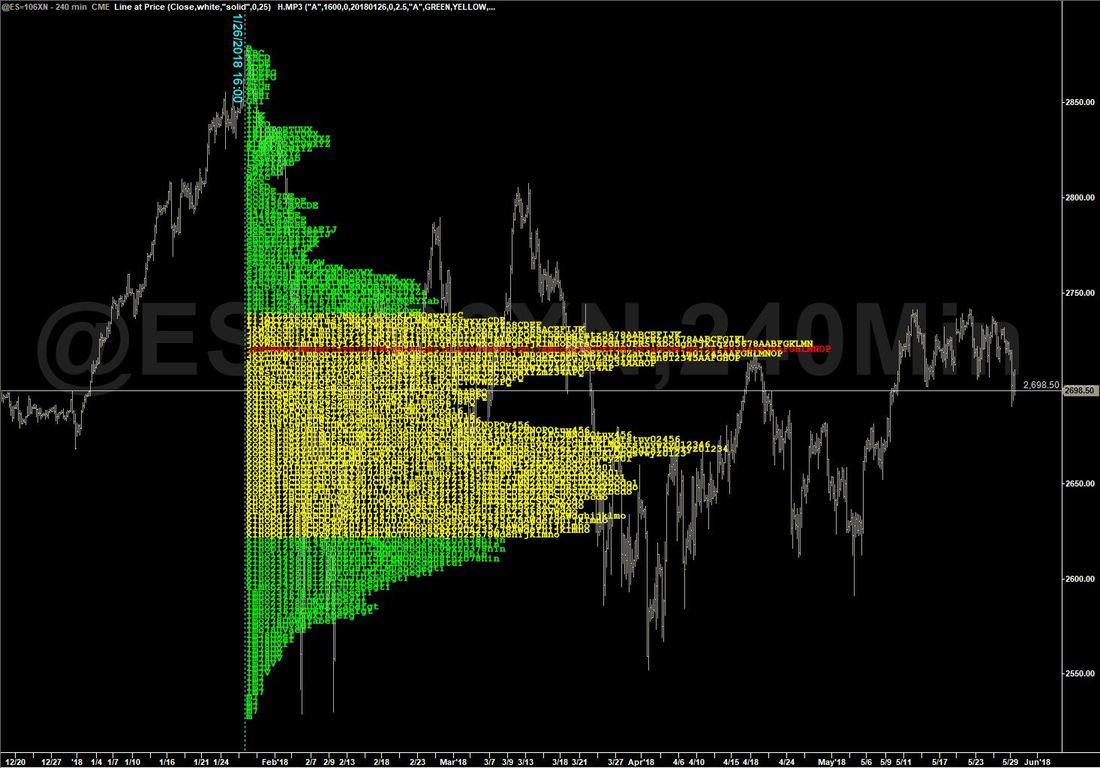
You can see that the developing POC (red row of characters), sits above current price which is "filling in" a price area that looks like an anomaly. This visual allows me to judge where price may drop, if it indeed does drop.
Continuous Day Trading Timeframe
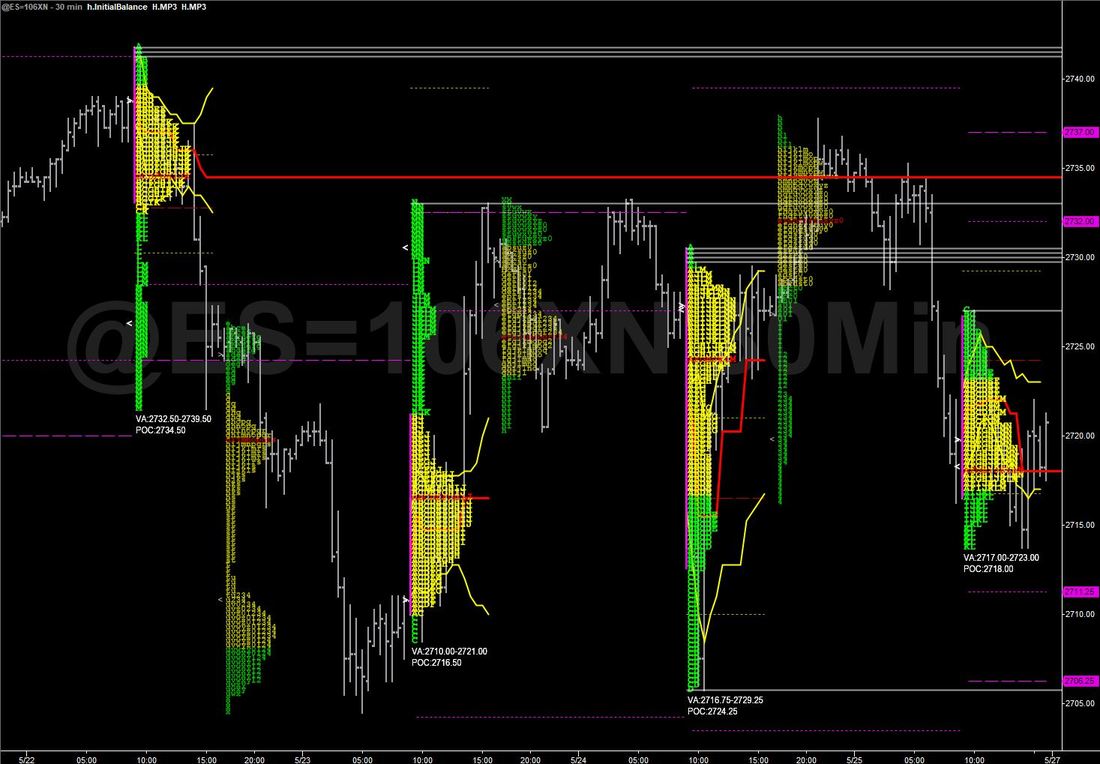
This chart can be found in the sample workspace that accompanies the indicator. This is one of my preferred day trading market profile charts where I can see the RTH and ETH profiles, value areas, and POCs; the purpose of this chart is to plan day trade opportunities. Including the ETH trading timeframe allows me to see whether profile structures created in the previous RTH session are respected or violated. I use the @ES=106XN symbol rather than @ES that is inserted in the sample workspace:
RTH Timeframe
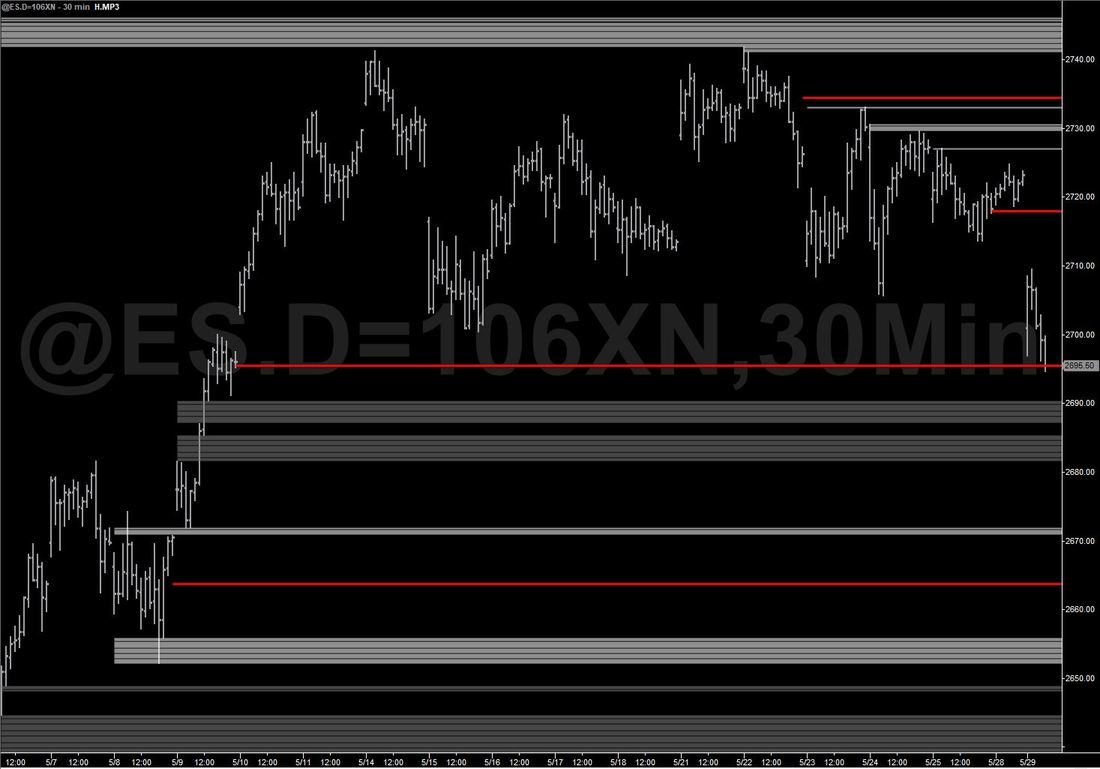
This is my other preferred day trading market profile chart where I can see only the RTH profiles with naked POCs, tails, and anomalies; the purpose of this chart is to plan day trade opportunities. I use the @ES.D=106XN 30 minute chart
- H.MP3 "turns off" the display of all information with the exception of naked POC: Show it #, Tails: Show them #, and Anomalies: Show them # = 1. Number of Profiles to Keep=-1,Caret: Show it?=Session Stats: Show them?=False.