Integrate Cumulative Tick with VWAP
Watch this video to learn how to use VWAP & Cumulative Tick Indicators to Trade Equity Index Futures & ETFs
Cumulative Tick and VWAP can be important measures of market internals that when combined together, may improve your trading odds of a VWAP fade. To support my day trading of ES (or SPY) I build a chart that looks like the following (from Dec 10, 2018):
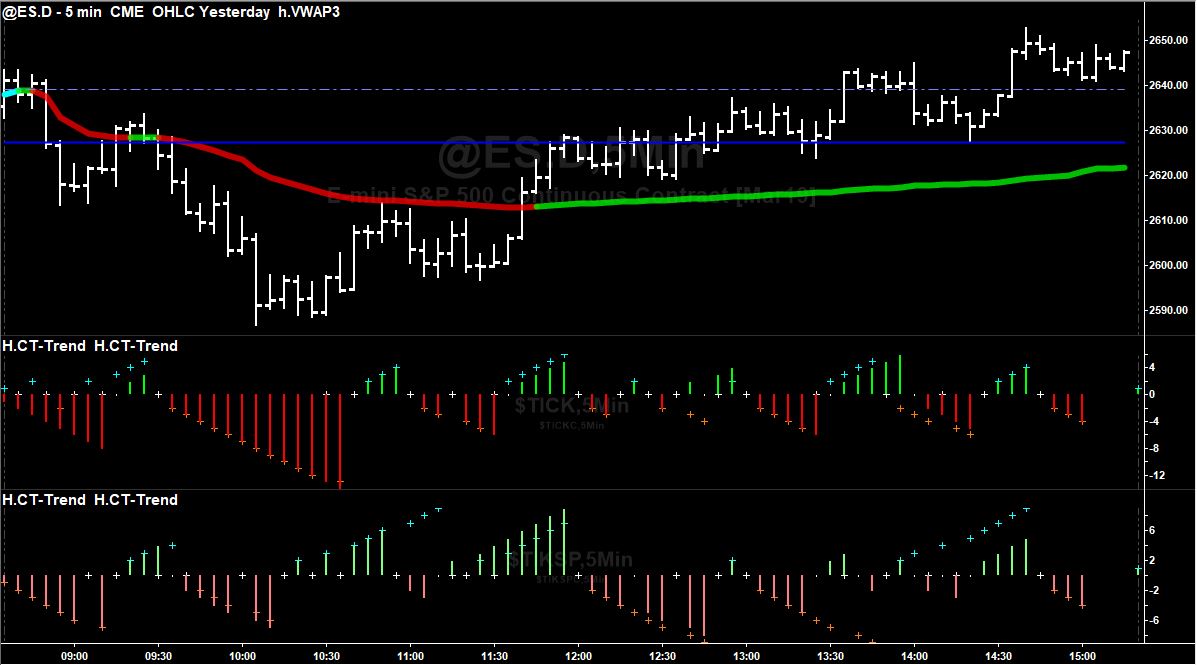
This chart contains FIVE symbols, displayed in THREE different sub-graphs. The symbols are:
The $TICK, $TICKC, $TIKSP, and $TIKSPC symbols are scaled on no-axis (scaling tab) and price data is invisible (style tab). Since these symbols are from different exchanges, the display timezone is local (settings tab) for all symbols.
Now that the symbols are applied to the chart, it is time to insert indicators.
- @ES.D (or SPY), 5 minutes (Data1, Sub-graph 1)
- $TICK, 5 minutes (Data2, Sub-graph 2)
- $TICKC, 5 minutes (Data3, Sub-graph 2)
- $TIKSP, 5 minutes (Data4, Sub-graph 3)
- $TIKSPC, 5 minutes (Data5, Sub-graph 3)
The $TICK, $TICKC, $TIKSP, and $TIKSPC symbols are scaled on no-axis (scaling tab) and price data is invisible (style tab). Since these symbols are from different exchanges, the display timezone is local (settings tab) for all symbols.
Now that the symbols are applied to the chart, it is time to insert indicators.
- IBH VWAP is inserted in subgraph 1 and it is based on @ES.D (Data1).
- IBH CUMULATIVE TICK Trend is inserted FOUR times; twice in sub-graph 2 and twice in sub-graph 3
- Sub-graph2:
- The first instance of CT Trend is based on $TICK (Data2), upColor=Green, dnColor=Red, Plot Style=Histogram
- The second instance of CT Trend is based on $TICKC (Data3), upColor=rgb(0,255,255), dnColor=rgb(255,128,0), Plot Style=Cross
- Sub-graph3:
- The first instance of CT Trend is based on $TIKSP (Data4), upColor=Green, dnColor=Red, Plot Style=Histogram
- The second instance of CT Trend is based on $TIKSPC (Data5), upColor=rgb(0,255,255), dnColor=rgb(255,128,0), Plot Style=Cross
- Update tick-by-tick is NOT enabled in any of these indicators
- Sub-graph2:
- To make it easy to see the previous day hi, lo, and close, I insert the TradeStation "OHLC Yesterday" indicator on sub-graph 1 (this information provides context, but does not influence this strategy).
How To Trade
When the trends for VWAP and cumulative tick for $TICK, $TICK, $TICKSP, and $TIKSPC are aligned with the VWAP trend then it may be appropriate to fade pullbacks to VWAP.
I call this the "Match Colors" fade.
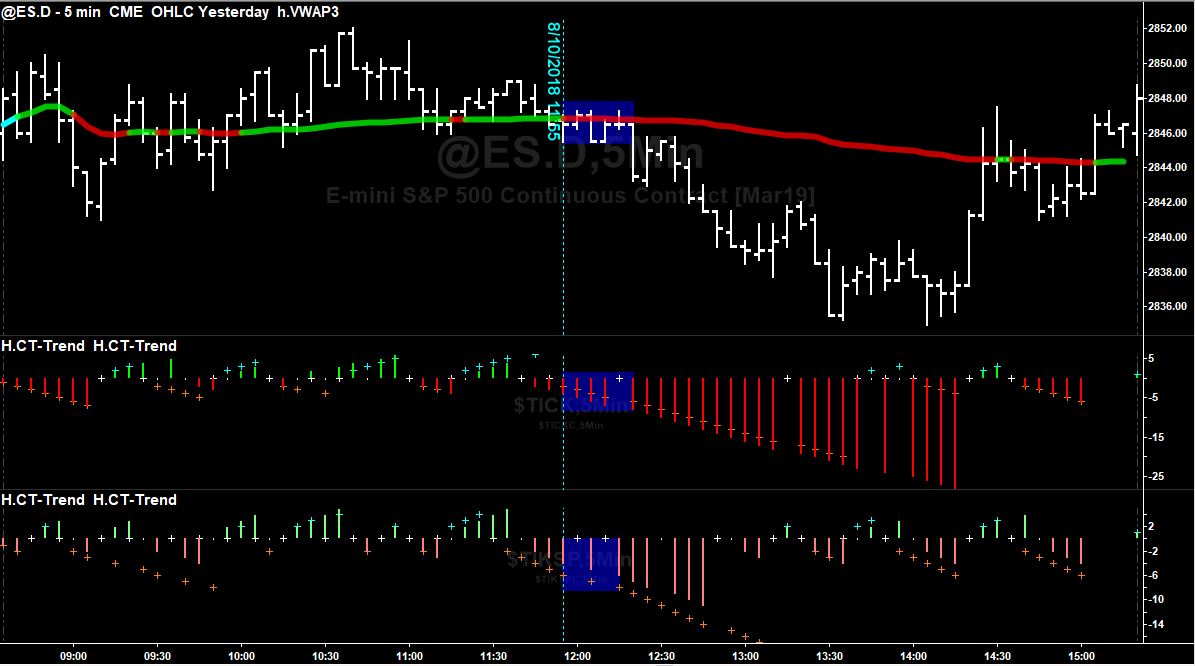
When the trends diverge or are choppy then trading is generally more challenging. The following is an example of trend alignment for @ES.D on August 10, 2018. Focus on the bars that begin at 11:55 (the cyan vertical line). The VWAP is beginning to trend down (red), the four cumulative tick trends are either continuing down or bouncing around 0 which gives insight into a weakening market. When these colors align consider a VWAP fade (short):
I call this the "Match Colors" fade.
When the trends diverge or are choppy then trading is generally more challenging. The following is an example of trend alignment for @ES.D on August 10, 2018. Focus on the bars that begin at 11:55 (the cyan vertical line). The VWAP is beginning to trend down (red), the four cumulative tick trends are either continuing down or bouncing around 0 which gives insight into a weakening market. When these colors align consider a VWAP fade (short):
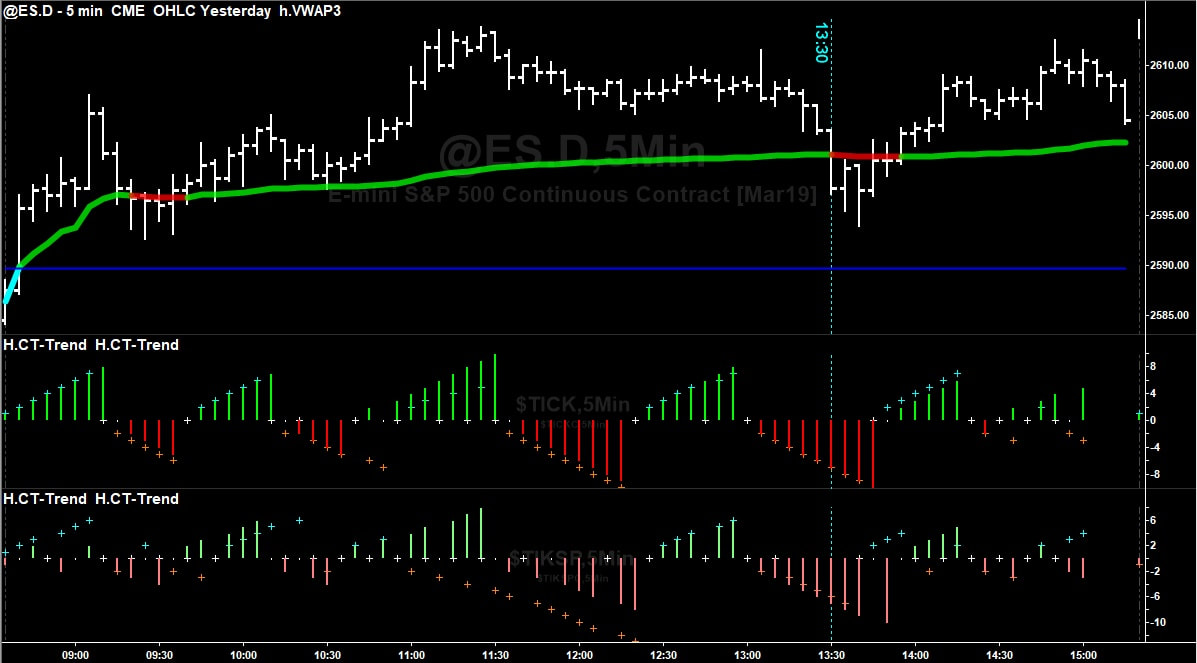
The following is a perfect example from January 15, 2019 at 1:30pm CT of a failed VWAP fade (long on VWAP test) that would have been avoided if the trader was aware of the cumulative tick trends:
Next Step - Create Your Trading Plan
- Build a chart with SPY or @ES.D with 12 or more months of data
- Add the indicators as described above
- Scroll left to the earliest date in the chart
- Read the price action in context with the VWAP trend and cumulative tick trends; take notes to describe the situations where the VWAP fade succeeded and failed
- Summarize findings, write your plan, paper trade your plan to validate the plan
