IBH Initial Balance for TradeStation®
Initial Balance is the price range resulting from market activity (generally) during the first two 30 minute periods.
|
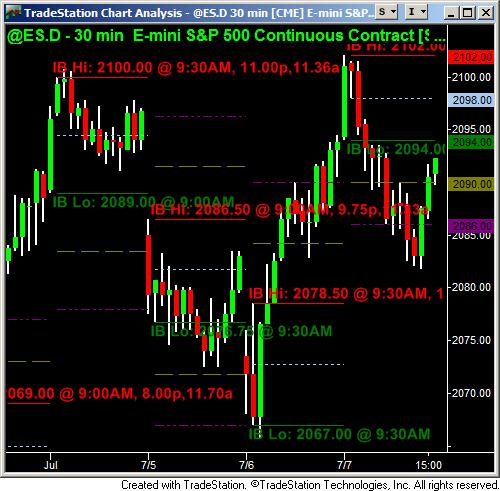
Default Output of the Indicator
|
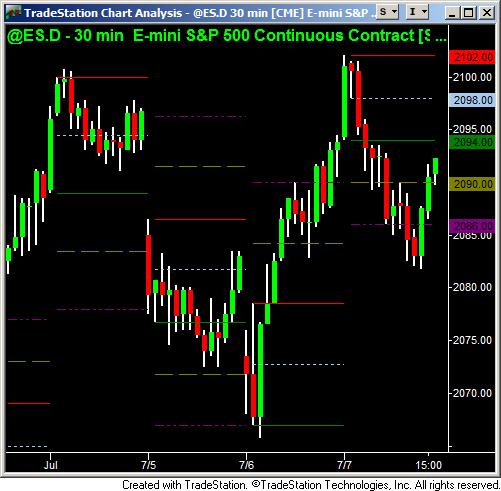
"Statistics Free" Output of the Indicator
|
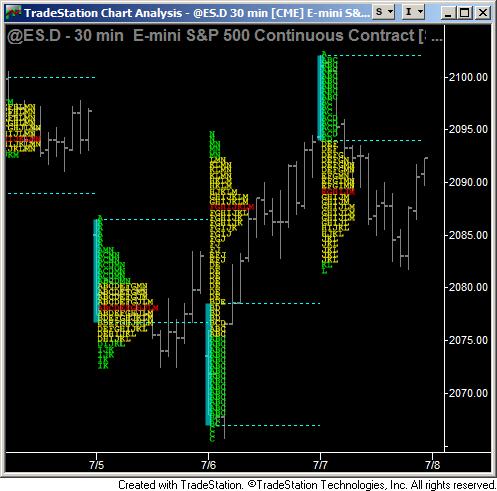
Output in "Market Profile" mode with the Market Profile Indicator (available separately)
|
Subscribe
To subscribe, select a free 30 day trial or a $119 lifetime subscription. This Initial Balance product is also contained in the Market Profile Combination Pack.
Documentation
Sample Workspace
Click here to download the IBH INITIAL BALANCE SAMPLE WORKSPACE OCT 2023.TSW file for TradeStation 10.0 Update 70 and higher (newer). If your platform is older than Update 70 then you may not be able to load the workspace, but you will be able to create new charts with the indicators provided in your subscription.
The workspace contains several different charts with initial balance indicator inserted into each chart. When you open the sample workspace you will see the following windows:
The workspace contains several different charts with initial balance indicator inserted into each chart. When you open the sample workspace you will see the following windows:
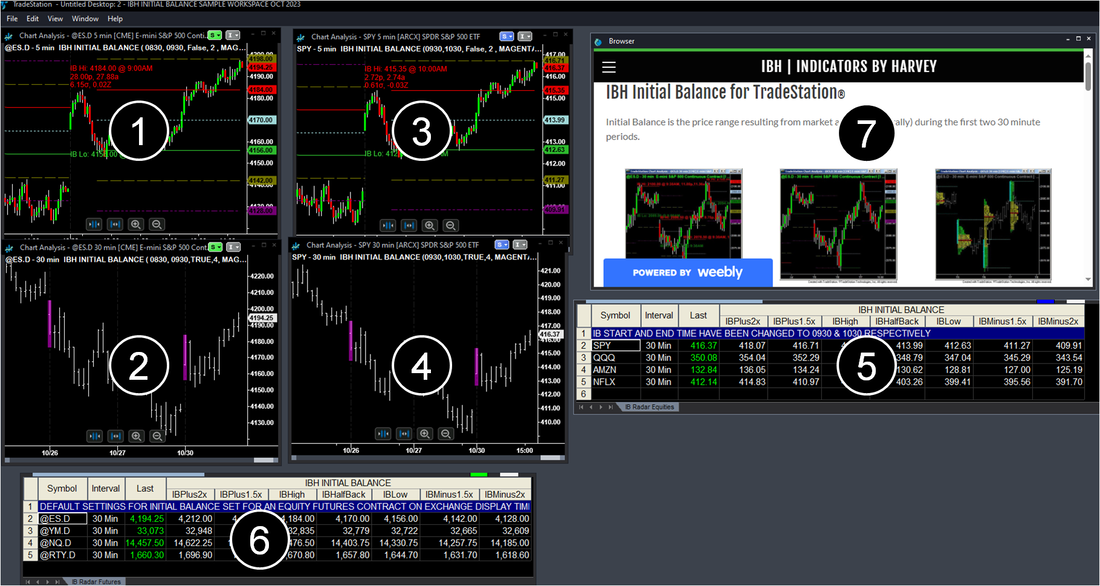
Chart 1 - Equity Index Futures Chart
Symbol linked with radarscreen 6. Default parameters with the exception that the Start Time is set to 0830 and the End Time is set to 0930. The display time zone is set to Exchange.
Chart 2 - "Market Profile" Mode for Equity Index Futures
Same settings as for Chart 1 except that the vertical line has been turned on and the other chart items have been turned off. This is the typical IB setting when placed on a market profile chart.
Chart 3 - "Market Profile" Mode for Equities.
Similar to chart 2. Except that symbol linked with radarscreen 5. Default parameters with the exception that the Start Time is set to 0930 and the End Time is set to 1030. The display time zone is set to Exchange.
Chart 4 - Equities Chart.
Similar to chart 1. Except that symbol linked with radarscreen 5. Default parameters with the exception that the Start Time is set to 0930 and the End Time is set to 1030. The display time zone is set to Exchange.
Radarscreen 5 - Equities
Chart interval is set to 30 minutes. The indicator is configured to run in the radarscreen so look at the General tab settings, specifically the "Load additional data..." setting.
Radarscreen 6 - Index Futures
Similar to radarscreen 5.
Browser Window 7
Gets you here...
Interesting Initial Balance Facts
Did you know that the emini S&P 500 regular trading hours contract (@ES.D) trades outside the initial balance range (either above IB High or below IB Low) by at least one tick on about 98% of all trading days ? The following table shows the percentage by month, by year, and in aggregate:
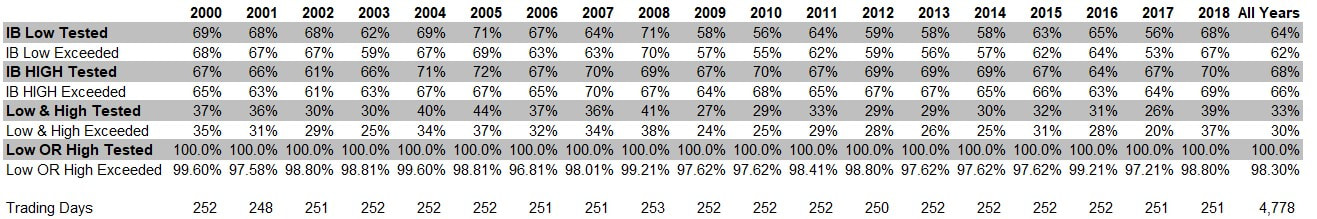
The data from these charts include all @ES.D trading from January 3, 2000 through December 31, 2018.
If you can see the Initial Balance range then you can plan your trades accordingly. Note: future market behavior may differ from that described in these data tables.
If you are comfortable with Twitter click here to see my most recent #IB (initial balance) tweets.
If you can see the Initial Balance range then you can plan your trades accordingly. Note: future market behavior may differ from that described in these data tables.
If you are comfortable with Twitter click here to see my most recent #IB (initial balance) tweets.
